After 29 games, the Tampa Bay Rays have met certain expectations, thanks in large part to the pitching staff, while lagging at others due to the offense. Inspired by the Process Report, we sought out to answer a simple question: How are the Rays doing so far in this relatively young season? Today I’ll break down two offensive statistics ― weighted on base average (wOBA) and weighted runs above average (wRAA) ― in an attempt to suss out the answer to that query.
First off, let me define the key statistics ― wOBA and wRAA (both via FanGraphs) ― to give you a better understanding of what you will be looking at.
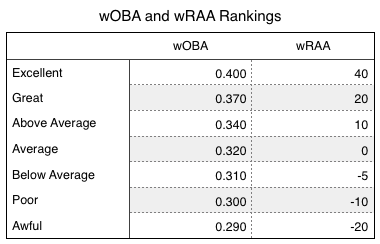 wOBA
wOBA
Weighted On-Base Average (wOBA) combines all the different aspects of hitting into one metric, weighting each of them in proportion to their actual run value. While batting average, on-base percentage, and slugging percentage fall short in accuracy and scope, wOBA measures and captures offensive value more accurately and comprehensively.
wRAA
Weighted Runs Above Average (wRAA) measures the number of offensive runs a player contributes to their team compared to the average player. How much offensive value did Evan Longoria contribute to his team in 2009? With wRAA, we can answer that question: 28.3 runs above average. A wRAA of zero is league-average, so a positive wRAA value denotes above-average performance and a negative wRAA denotes below-average performance. This is also a counting statistic (like RBI), so players accrue more (or fewer) runs as they play.
The Good ― Logan Forsythe, Brandon Guyer, Steve Pearce and Steven Souza Jr.
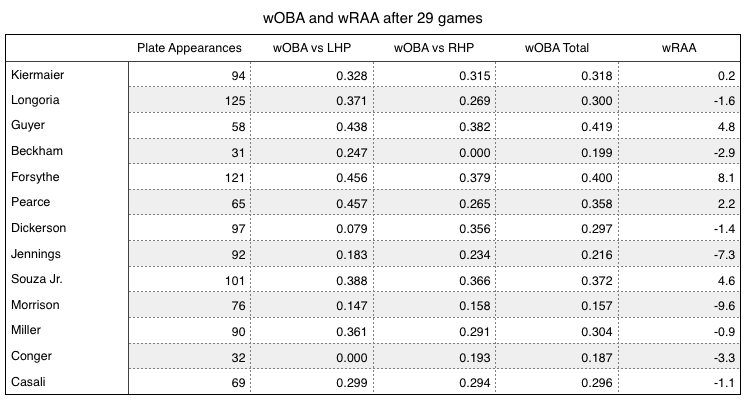
Forsythe has been predictably good out of the leadoff spot, reaching base often and driving in crucial runs as opportunities arise. He has posted elite numbers against lefties and great numbers against righties. Likewise, Brandon Guyer has been very good against lefties and righties, making the most of his time by collecting a 4.8 wRAA in just 58 plate appearances as of Monday night.
Both Pearce and Souza have been productive thus far (2.2 and 4.6 wRAA, respectively), and that output should increase with continued playing time. Dare I say Souza’s production might almost be enough to overlook his 36.6% strikeout rate and his running gaffes on the base paths?
The Bad ― Evan Longoria, Tim Beckham, Desmond Jennings, Logan Morrison and Hank Conger
Longoria has fared well against southpaws, although the struggle against righties is real. Part of the problem, as Adam Sanford (DRaysBay) noted, is his willingness to swing at anything remotely close to the zone. His defensive work shouldn’t go overlooked, and the hope remains that he can make the proper adjustments to increase his production against right-handers.
As it relates to Jennings, it truly is a shame that you can’t have a roving designated hitter, after all his defense has been solid even when his time in the batter’s box has left a lot to be desired. It is no wonder that Kevin Cash has relied upon Brandon Guyer more often of late regardless of the handedness of the pitcher on the mound.
Concerning Morrison and Conger, I’ll let the numbers above do all the talking.
The Argyle ― Kevin Kiermaier, Brad Miller, Corey Dickerson and Curt Casali
Kiermaier has done well against righties so far, and better than one could have imagined against lefties. The Outlaw has shown surprising pop, already collecting a third of his total home run output of 2015 in just 94 plate appearances this season.
What a difference a few weeks has made for Miller. The Rays shortstop collected a -2.7 wRAA through most of April before snapping out of his funk toward the end of the month, and putting up a .440 wOBA/1.9 wRAA since. He’s also lowered his K% from 26.8% in April to 26.1% in May…a modest adjustment, but an adjustment nonetheless.
Dickerson has fared well against righties, however, his production has been nonexistent against lefties. The DH/OF has collected just one hit, one walk and six strikeouts against LHP, compared to 15 hits (including six homers), six runs, and 12 RBI against RHP. Dickerson was brought in as a platoon option for the DH spot in the lineup. With 20 accrued plate appearances against LHP, perhaps it’s time to put someone else in the lineup against left-handed hurlers.
After a miserable start to the season, Casali is looking better. Of his 13 hits, three are doubles and four are homers. Casali increased from a .191 wOBA/-5.11 wRAA/.104 ISO in April to a .589 wOBA/3.9 wRAA/.625 ISO in May. In an ideal world he will lower his 42% strikeout ratio* and start putting together more consistent plate appearances.
Conclusion
It will be interesting to see how these numbers change over the next 29 games. Who will get hot and who will cool down? On thing is certain, if the Rays are going to be the team they were projected to become, the unproductive many will need to step up to the literal and figurative plate.
Be on the lookout for our breakdown of pitching and defense in the next few days.
*Casali’s already lowered his K% by 5% in the last week