A little more than a week before the start of Spring Training, Baseball Prospectus released its PECOTA projections for the 2019 season. The Rays have been active this offseason, adding a bevy of new players to the fold, such as Yandy Diaz, Avisail Garcia, and Charlie Morton. Because of the acquisitions, PECOTA forecasts Tampa Bay as the fifth best team in the American League, and the third best team in the AL East with a mean average of 86 wins against 76 losses. Should the Rays end the season as the fifth best team in the AL, they would find themselves in the playoffs for the first time since 2013.
Here are a few highlights, as the full projection is available at the Baseball Prospectus site (linked above) with a paid subscription. Note: Any additions or subtractions to or from the roster will affect the mean projection.
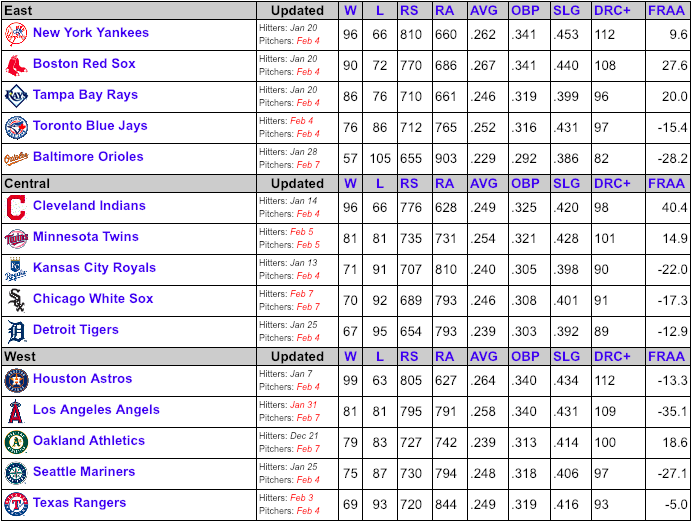
- PECOTA projects the Rays to be, well…the Rays in 2018. Their projected 710 runs are fewer than they plated in 2018, yet three runs better than the Royals, who are projected to end the upcoming season 20 games under .500. The projected .246 BA/.319 OBP/.399 SLG slash line is similar to that of the .258 BA/.333 OBP/.406 SLG line collected by the team last season.
- PECOTA projects Tampa Bay to allow the fourth fewest runs in the American League at 661 ― 25 fewer than the reigning World Series champions, and one more than the Yankees, Tampa Bay’s closest competitor in that category.
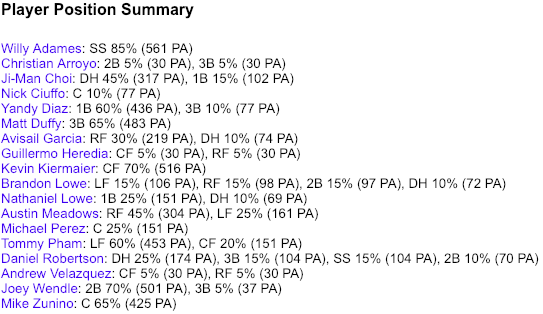
PECOTA sees Matt Duffy spending the most time at third base, with Joey Wendle getting the majority of reps at second base, Yandy Diaz at first, and Willy Adames at shortstop. Ji-Man Choi could be the primary designated hitter (45% of the time) with Daniel Robertson also slated to see a significant amount of time at the position as well as all over the infield.
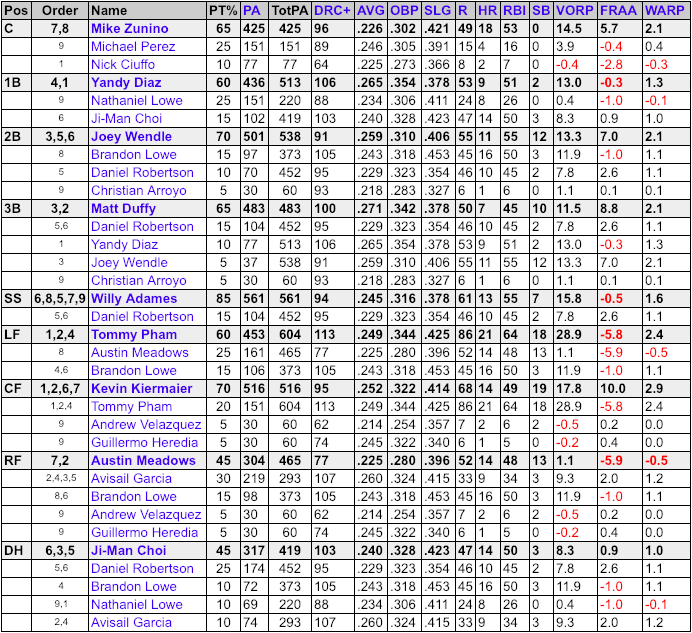
- Not surprisingly, Mike Zunino will get the majority of playing time over Michael Perez (65% vs 35%) behind the plate.
- Kevin Kiermaier is projected to post the highest position player WARp (2.9) in center, and could slash a .252 BA/.322 OBP/.414 SLG line with 14 home runs and 68 runs across 516 plate appearances. His projected WARp, however, is down from a projected 4.0 a season ago.
- The ever consistent Matt Duffy is projected to be the best hitter on the team, just ahead of Yandy Diaz and Avisail Garcia, who looks to bounce back from a lackluster 2018 campaign.
- Tommy Pham and Mike Zunino are projected to combine for 39 homers.
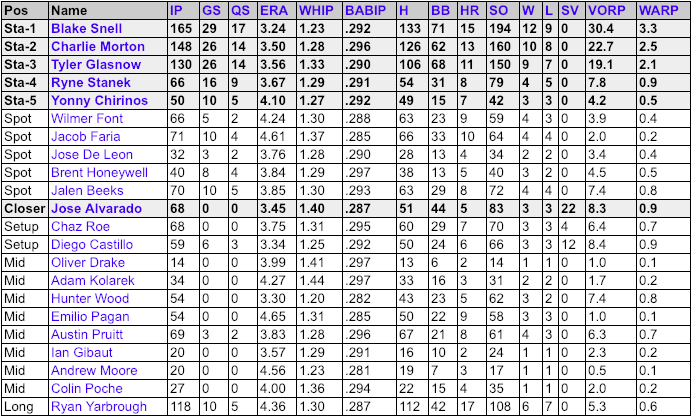
- PECOTA projects the starting rotation to be Blake Snell (165 IP, 3.3 WARp), Charlie Morton (148 IP, 2.5 WARp), Tyler Glasnow (130 IP, 2.1 WARp), with a casting call of “openers” ahead of Ryan Yarbrough (118 IP, 0.6 WARp), Jacon Faria (71 IP, 0.2 WARp), and Jalen Beeks (70 IP, 0.8 WARp) among others.
-
PECOTA projects the key Rays bullpen pieces as the following: Jose Alvarado (closer), Chaz Roe and Diego Castillo (setup), Oliver Drake, Adam Kolarek, Hunter Wood, Emilio Pagan, Austin Pruitt, Ian Gibaut, Andrew Moore, and Colin Poche — in some variation of the Durham Taxi — as middle-relief.
-
There is one category that I haven’t touched upon yet, and that’s FRAA — fielding runs above average. According to Baseball Prospectus, FRAA is an “individual defensive metric created using play-by-play data with adjustments made based on plays made, the expected numbers of plays per position, the handedness of the batter, the park, and base-out states.” In other words, the biggest difference between FRAA and similar defensive metrics is the data and philosophy used. While other metrics analyze zone-based fielding data, FRAA focuses on play-by-play data, focusing on the number of plays made compared to the average number of plays made by a player at said position.
-
PECOTA (by way of FRAA) pegs Tampa Bay’s defense to save 20 runs above average — third best in the American League. When compared with the other teams in the AL East, the Rays sit in second place behind the Red Sox (27.6 FRAA). Look on the bright side, the Baltimore Orioles and are projected for a -28.2 FRAA — worst in the American League.
Conclusion
Projecting an upcoming season is not an exact science. Neil Paine (538 blog) said it best:
There’s a statistical limit to how accurate any projection about a team can be in the long run. Years ago, sabermetrician Tom Tango researched the amount of talent and luck that go into team winning percentages and found that chance explains one-third of the difference between two teams’ records. That makes it hard to predict how many times a team will win over a season. The smallest possible root-mean-square error (a mathematical way of testing a prediction’s accuracy) for any projection system over an extended period of time is 6.4 wins. In a single season, forecasters can — and do — beat an RMSE of 6.4. But whenever that happens, it’s due to luck. The amount of random variance that goes into team records makes the 6.4 barrier literally impossible to beat over a large number of seasons. Over time, no forecaster’s system can ever do better.
The Rays ended last season with 90 wins and 72 losses. Their projected 86 win season — 92 or 80, thanks to a six-game margin of error — has got to make us incredibly optimistic for a postseason run.