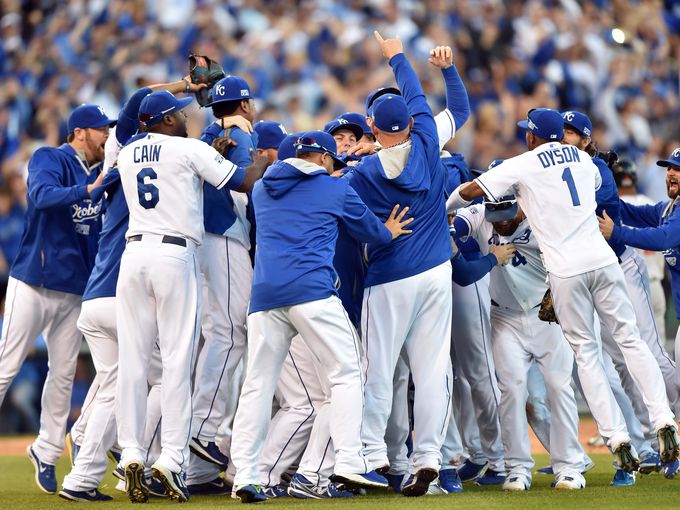
It’s all come down to this; two Wildcard teams are in this year’s World Series, and I couldn’t be more excited. For the San Francisco Giants, they are once again playing for the championship in an even-numbered year, while the Kansas City Royals haven’t made the playoffs in 29 years, yet they swept the Angels and Orioles to go 8-0 in the playoffs to make it to the World Series. The Royals became first team in MLB history to win their first eight consecutive postseason games following their 2-1 victory Wednesday in the ALCS series finale.
Let’s see how both teams stack up against one another.
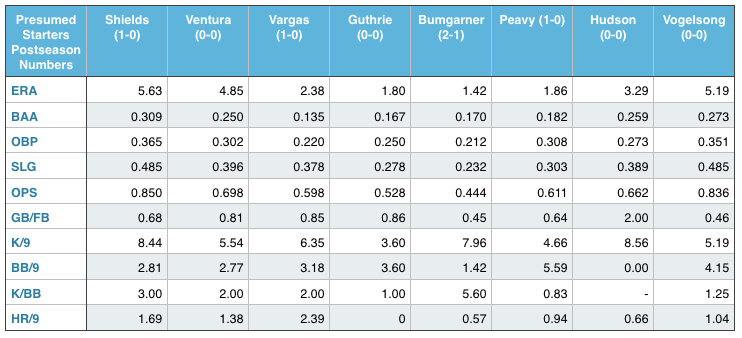
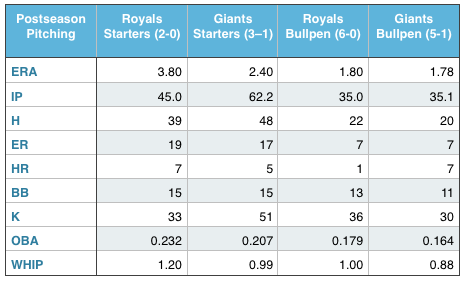
Pitching
Despite surrendering the lead twice in Game five of the NLCS, Madison Bumgarner has been downright spectacular in the playoffs. He’s thrown a post-season best 31-2/3 IP allowing only 19 hits and five walks, while striking out 28 and culling a 1.42 ERA along the way. On the other hand, James Shields hasn’t be great thus far, 10 earned runs on 21 hits (including 3 HR) in 16 innings of work. Though his 5.63 postseason ERA is less than spectacular, Shields does generate ground balls and is still very good at striking people out. He is also adept at making the all important big pitch in high leverage situations — yielding only one homer in high leverage situations during the regular season, while holding opponents to a .264 BA/.328 OBP/.380 SLG/.708 OPS/.310 wOBA slash line.
The Royals are by no means lacking after Shields. Yordano Ventura, Jason Vargas and Jeremy Guthrie have been good in their own right, with Vargas and Guthrie combining to give up only eight hits in 16-1/3 innings on the bump.
After Bumgarner, Tim Hudson — who owns a 1.02 WHIP in the playoffs, and Jake Peavy — who has allowed 2 ER in 9-2/3 IP, have done an excellent job at keeping the Giants in the thick of things. A caveat for San Francisco: the Giants fourth starter, Ryan Vogelsong, has been fairly inconsistent, with the exception of his 5-2/3 inning outing against the Nationals in the NLDS.
Though the Royals’ back-end relievers have been highly vaunted throughout the season, the Giants’ bullpen is actually cumulatively better. Yusmeiro Petit, Santiago Casilla, Jeremy Affeldt, Sergio Romo and Javier Lopez have combined for 28-2/3 innings of one earned run ball, compared to the Royals’ Wade Davis, Kelvin Herrera and Greg Holland who have yielded 3 ER over 25-2/3 innings of work.
This series could be decided by how well the Giants can control the Royals’ running game. At 30%, Buster Posey’s caught stealing percentage in the regular season is just over league average, which isn’t bad at all. However, Bumgarner allowed seven of 17 would be base runners to swipe a bag in the regular season, while Vogelsong allowed 12. If anything, the Royals will have ample opportunity to swipe bases against Hudson, who allowed 83% of base stealers to be successful. As Brandon Jopko of Baseball Hot Corner noted, the other pitchers on San Francisco’s roster come in below league average which means that, for example, when Affeldt (0% CS in 6 attempts) and/or Petit (21% CS in 19 attempts) come in, watch out if a batter reaches.
Neither team can truly be considered to be an offensive juggernaut, and the winner may be the team who limits the the long ball — something the Royals have done well at both in the regular season and in the playoffs. Preventing errors on the field while maintaining solid defense will play a huge role, in addition to which team has the most luck on balls in play.
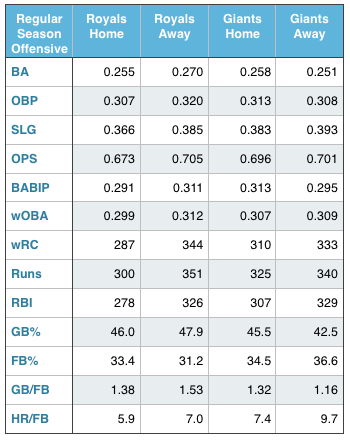
Offense
The Royals have the edge offensively. They’ve dominated the running game (13 stolen bases compared to just three by the Giants), shown more extra-base power and on-base skills, and hit for a higher average. Although they tend to strike out more, I’d hardly call 19% a bad percentage.
Eric Hosmer has come up big on a few occasions (hence the top ranking in RC), but Lorenzo Cain is the most consistent hitter thus far in the playoffs having gone 3-6 wRISP. His production surge could be chalked up to Cain being hot, however. He wasn’t nearly as consistent wRISP during the regular season.
There are few irregularities that can be chalked to the small sample size created by the playoffs. Mike Moustakas has a 5.0 RC despite not a single hit with runners on second or third, which can be attributed to his four homers. Pablo Sandoval has only one run batted in despite posting a .326 batting average overall — his .111 BA wRISP speaks to that. And while Brandon Crawford hit a grand slam in the wild card game, he has only one run since thanks to a sacrifice fly.
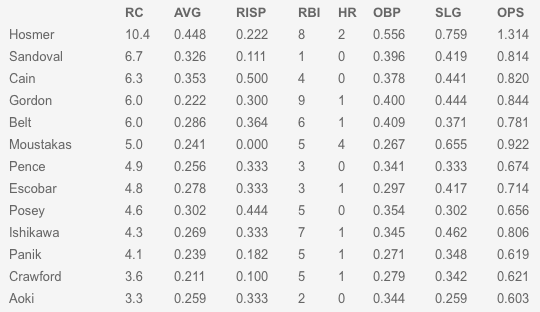
As a team, the Royals have out-homered the Giants 8 to 5 thus far. For the Giants, each homer has either tied the game, given them the lead, or won the game. The Royals too have homered in crucial spots – that’s why they’re 8-0.

However, if the regular season offensive numbers suggest anything, this World Series promises to be a low scoring affair between a pair of evenly keeled teams… Something that becomes all the more evident when you consider how close each team is to one another in most of the below mentioned categories, including total runs scored — a difference of only 14 runs separate both teams (an average of just over 4.01 runs per game).