A little less than a week after we began to dissect the 2016 ZiPS projections for the Tampa Bay Rays, Baseball Prospectus released their PECOTA projections for the upcoming season. The projection system likes Matt Silverman’s off-season moves, forecasting the Rays to lead the AL East with a mean average of 91 wins. And though the team still needs to add a few key pieces to the bullpen, the PECOTA projections offer a fairly optimistic look at the forthcoming season.
How will the Rays win the East? Here are a few highlights from Baseball Prospectus. A full projection is available at the Baseball Prospectus site (linked above) with a paid subscription.
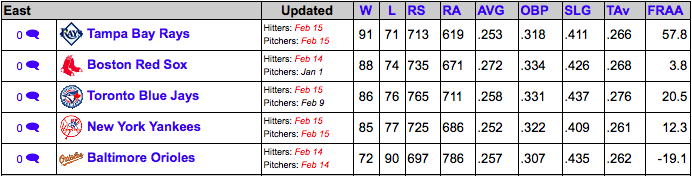
- PECOTA projects the Rays to be, well…the Rays in 2016. That is, they’re projected to be dominant thanks to pitching and defense. Their projected 619 runs allowed is second best in the American league ― just four runs behind Cleveland ― for fewest runs given up. The Nate Silver curated system projects Tampa Bay to score 713 runs — 69 more than they plated in 2015. The projected .253 BA/.318 OBP/.411 SLG slash line is similar to that of the .252 BA/.314 OBP/.406 line collected by the team last season.
- Overall, the Rays true average (Tav; a measure of total offensive value scaled to batting average) of .266 is 14 points higher than last season’s batting average. Of note, their projected slugging percentage is higher than the Yankees, who have a tailored stadium to help them along.
- PECOTA projects Hank Conger to get the majority of playing time behind the plate, followed by a platoon of Curt Casali and Rene Rivera. At first, James Loney looks to get the bulk of the playing time, although he is projected to post a -0.7 WARp. Incidentally, first base looks to be the weakest spot for the Rays as it relates to WARp. Nevertheless, Loney’s -0.7 WARp is five points better than what he posted last season.
- Logan Forsythe appears slated for the majority of the playing time at second, although both Tim Beckham and Nick Franklin are also expected to get a significant amount of playing time on the right side of the diamond. At third, Evan Longoria looks to bounce back from a down season by posting a .285 TAv/4.0 WARp.
- PECOTA likes Brad Miller at short, so much so that he is projected to post a 2.7 WARp — 1.4 points higher than former Ray Asdrubal Cabrera, who is now with the Mets.
- Corey Dickerson and Desmond Jennings are projected to split time in left-field, with Brandon Guyer filling in as bench depth all over the outfield.
- Despite a TAv that is seven points higher (.275 vs .268), Chris Pearce looks to receive less playing time at DH than Logan Morrison.
- PECOTA projects the starting rotation to be Chris Archer (183 IP, 2.9 WARp), Jake Odorizzi (174 IP, 1.9 WARp), Erasmo Ramirez (154 IP, 1.0 WARp), Matt Moore (145 IP, 0.6 WARp), and Drew Smyly (148 IP, 1.6 WARp). Blake Snell, Alex Cobb, and Chase Whitley may all factor into the rotation in some capacity as well, especially as Cobb and Whitley recover from Tommy John surgery.
- There is one last category (in the chart above) that I haven’t touched upon yet, and that’s FRAA — fielding runs above average. According to the Baseball Prospectus, FRAA is an “individual defensive metric created using play-by-play data with adjustments made based on plays made, the expected numbers of plays per position, the handedness of the batter, the park, and base-out states.” In other words, the biggest difference between FRAA and similar defensive metrics is the data and philosophy used. While other metrics analyze zone-based fielding data, FRAA focuses on play-by-play data, focusing on the number of plays made compared to the average number of plays made by a player at said position.
- PECOTA (by way of FRAA) pegs Tampa Bay’s defense to save 57.8 runs above average — the best in baseball. When compared with the other teams in the AL East, the Rays out-rank their closest competitor (Toronto) by 37.3 runs, and New York by 45.5. Of those 57.8 runs saved, Kevin Kiermaier is projected to save 27.4. Loney, however, is expected to give up 4.4 runs. Compare that with Pearce who is projected to save 1.3 runs at first.
In conclusion
Projecting an upcoming season is not an exact science. Neil Paine (538 blog) put things into perspective:
There’s a statistical limit to how accurate any projection about a team can be in the long run. Years ago, sabermetrician Tom Tango researched the amount of talent and luck that go into team winning percentages and found that chance explains one-third of the difference between two teams’ records. That makes it hard to predict how many times a team will win over a season. The smallest possible root-mean-square error (a mathematical way of testing a prediction’s accuracy) for any projection system over an extended period of time is 6.4 wins. In a single season, forecasters can — and do — beat an RMSE of 6.4. But whenever that happens, it’s due to luck. The amount of random variance that goes into team records makes the 6.4 barrier literally impossible to beat over a large number of seasons. Over time, no forecaster’s system can ever do better.
The Rays could end the season playing relevant ball in October, then again they could go about reconfiguring the roster once more. Still, a projected 91 win season (85 or 97, thanks a six game margin of error) has got to make every Rays fan salivate for the 2016 season.